Finally Reporting Made Much Easier With Google’s Data Studio
Let’s be honest, creating and analysing reports can be boring for many people and even if you enjoy it we all have clients or colleagues who just can’t stand it. But that may be about to change. You may know about it or you may not but Google recently introduced a new free reporting tool to the world, further increasing their market dominance and gifting people with endless capabilities and enjoyment within the reporting world. Come in Data Studio!
I’m not gonna go into the nitty gritty of Data Studio and its capabilities but I hope to give you an understanding of the powers of this tool and how it breathes life into any current reporting you may already be doing. I’ll start with the basics and then I will progress and hopefully give you a slightly deeper understanding of some tips and tricks of the handy dandy tool.
The Artsy Touch
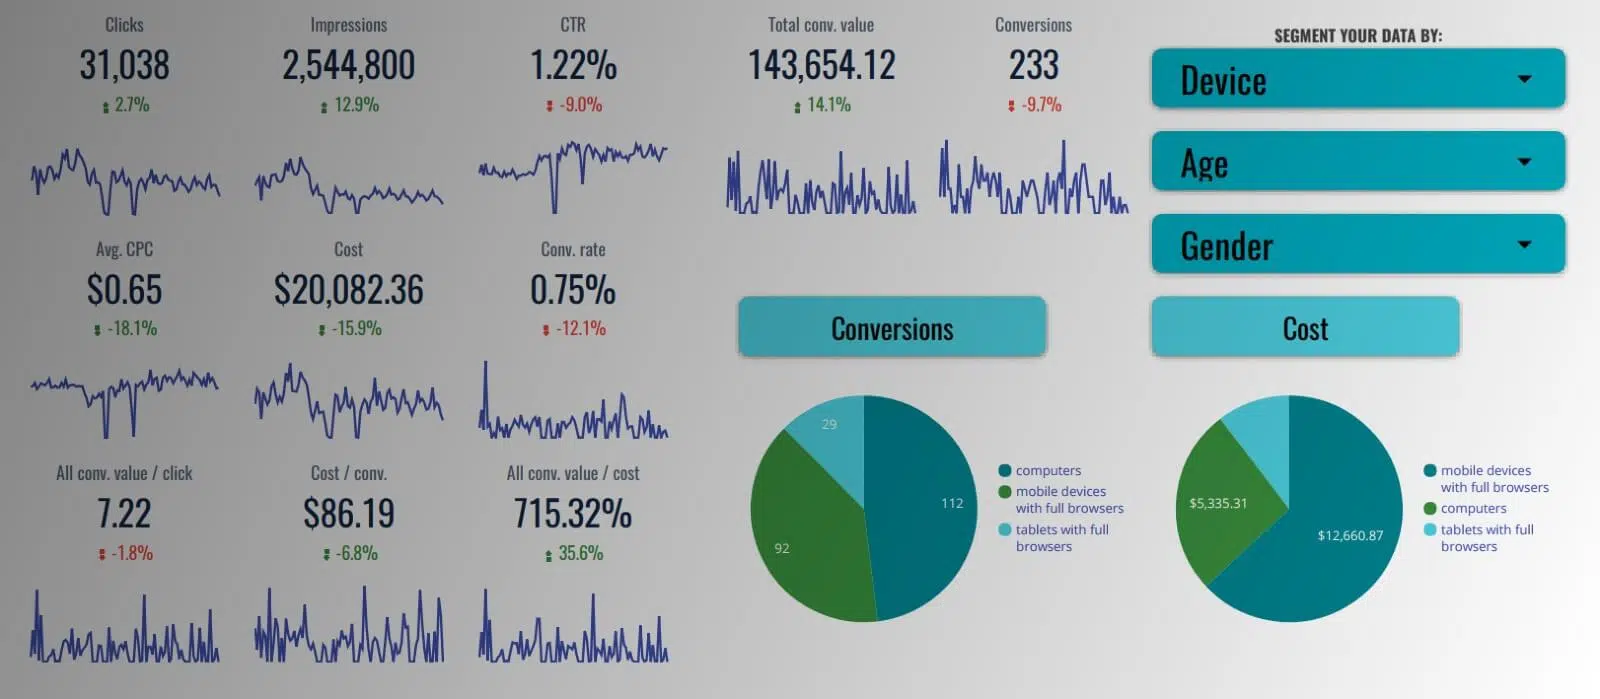
Firstly, I want to touch on the creative aspect. Who doesn’t like a bit of colour in their life? I don’t really need to say much on this point I hope. I mean just look at this! Just look how easy it is to read, so simple yet so much information in one little table. And to think this table took only a couple minutes to create and can be adjusted in a matter of seconds

Data Studio Dashboard
Let’s Get Real
Ok enough of the pretty stuff, let’s talk business and numbers! You want to know how well your account is doing, well I can tell you. What do you want to know? Any data that can be tracked (from Analytics to Google Ads to even Excel!) can be put into a Data Studio report! Want to know how many people go to your website from Facebook on Tuesday whilst on their iPhone 7? Easy, as you like it’s all set-up and you can see it all there.
Slice & Dice

Which brings me onto my next point: Filters! Google’s greatest gift to mankind (only second to their search engine). Data studio offers two types of filters, view filters and data filters (which are hidden from view). They both offer superlative flexibility, allowing the editor to make any aspect of an account hidden from a particular table/chart or from the whole report. Practically, these filters allow an account manager to for example only filter campaigns which they manage so that data is not skewed by irrelevant information.
View filters can allow the report to tell many different stories all at once. In our case I can add a view filter to the report, filtering ad groups or campaigns. Which enables the client to then be able to view each individual ad group/campaign or even select multiple options all at once.
Famous Last Words
Before I let you go on your merry way I will add that Data Studio is still relatively new and Google will only continue to add and improve the service. Google isn’t known to keep things the same for too long, they love making things better.
So what are you waiting for?
Jump on the bandwagon now, have some fun with your reports while it isn’t too complicated because before you know it you’re going to need a reports surgeon to come in and create your reports for you.
Please do share some favourite features you use to tell the story how it is in your reports?


